Frac Operations Platform
One operating layer
across the entire spread.
Pump fleets, gensets, turbines, existing PLCs, and mixed-OEM equipment — one operational view of equipment health, fleet performance, maintenance, and operating cost, across the assets you already own, without replacing the controls underneath them.
Four outcomes
Bigger than predictive maintenance. Smaller than replacing your fleet.
Operate the spread
Fleet status, hydraulic output, stage execution against plan, and alarms — one view across every pump unit and genset, whoever built them.
Protect the equipment
Power-end vibration, fluid-end health, turbine performance, bearings, and temperatures, read in the context of what the unit is actually doing.
Control operating cost
Idle fuel priced live, utilization, maintenance cost, downtime, and parts — the numbers that decide whether a spread made money this week.
Turn findings into work
Detection → diagnosis → approval → work order → history. A finding that doesn't become a repair is noise; KNOCE closes the loop.
If you run one OEM's fleet end to end, you have that OEM's platform. If you run anyone else's equipment — or a mix — KNOCE is the operations layer that doesn't depend on who built the pump.

The four numbers on top of every shift
Representative values. Idle fuel burn deserves the last word: it surfaces the cost of between-stage turbine operation as a live KPI in $/hr across the spread — on the operations screen while the idle decision is being made, not in a fuel report weeks later.
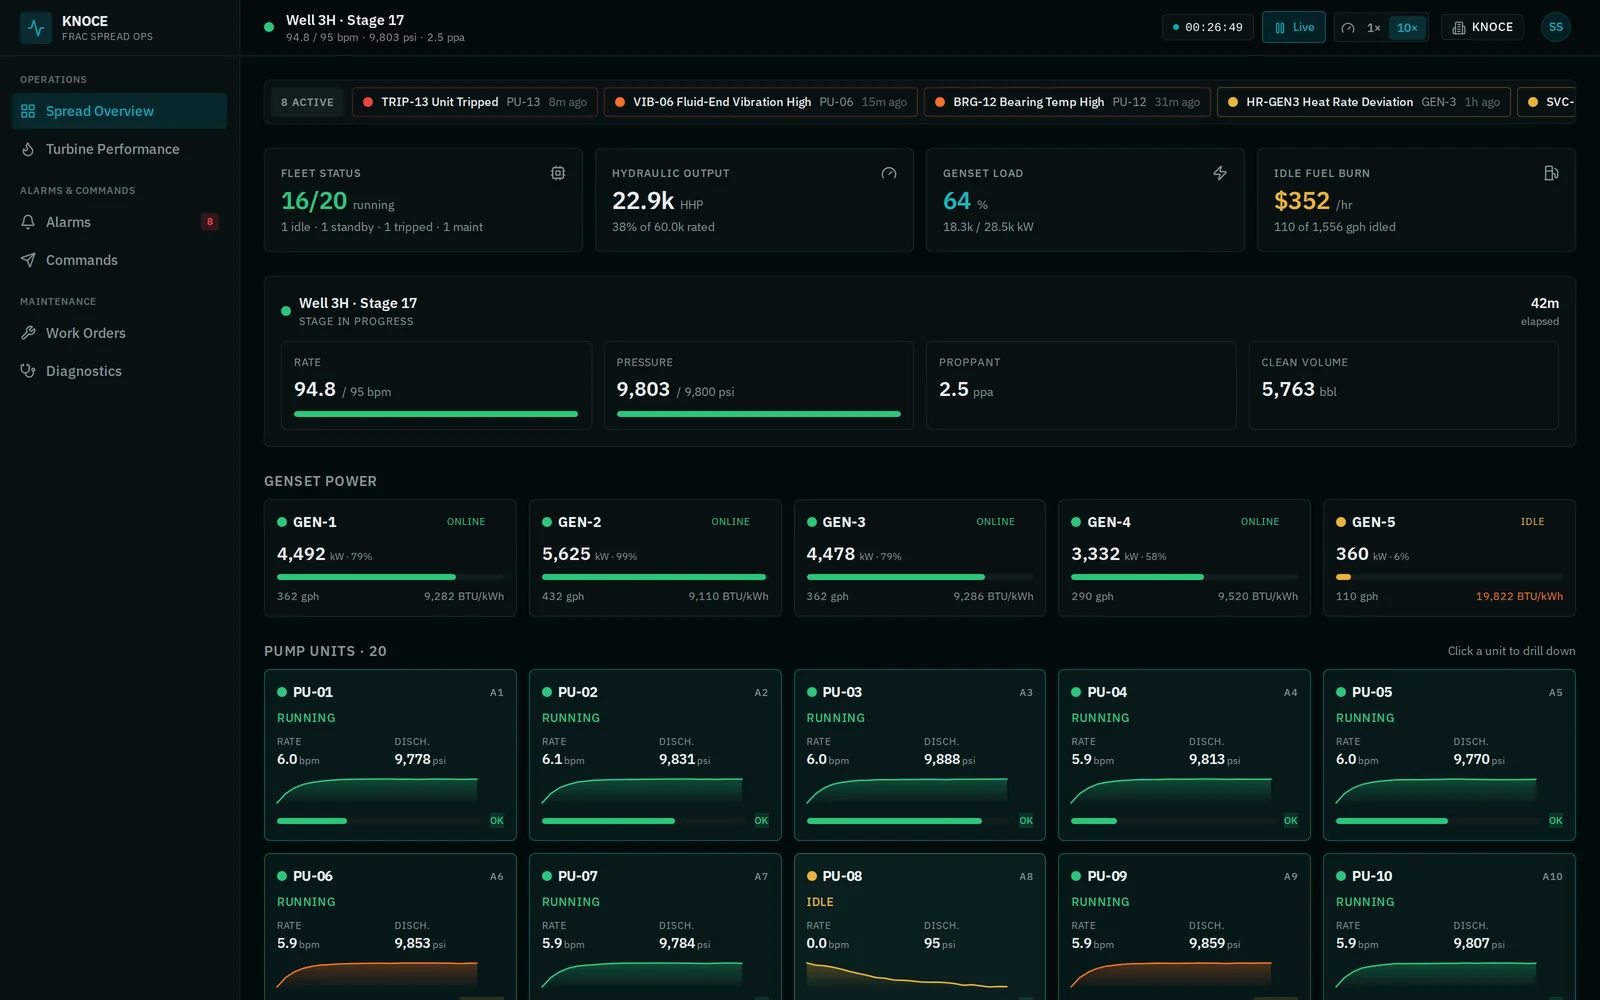
Spread Overview — every pump unit, every genset, the live stage, and the alarm ribbon on one screen.
See the spread
Live operations, from fleet to fluid end
Spread overview
A tile per pump unit — status, health, and live vitals — with the genset power strip, the current stage panel, and an alarm ribbon across the top. The screen a supervisor keeps open all shift.
Unit drill-down
Any unit, one click deep: discharge and suction pressure, rate, RPM, power-end and fluid-end vibration, bearing and lube-oil temperature — live and trended — beside run-time counters and service-interval status.
Turbine performance
Per-genset load curve with droop characterization, heat rate against the ideal curve, fuel rate, and exhaust temperature — the difference between a healthy turbine and a fouling one, visible on one chart.
Stage tracking
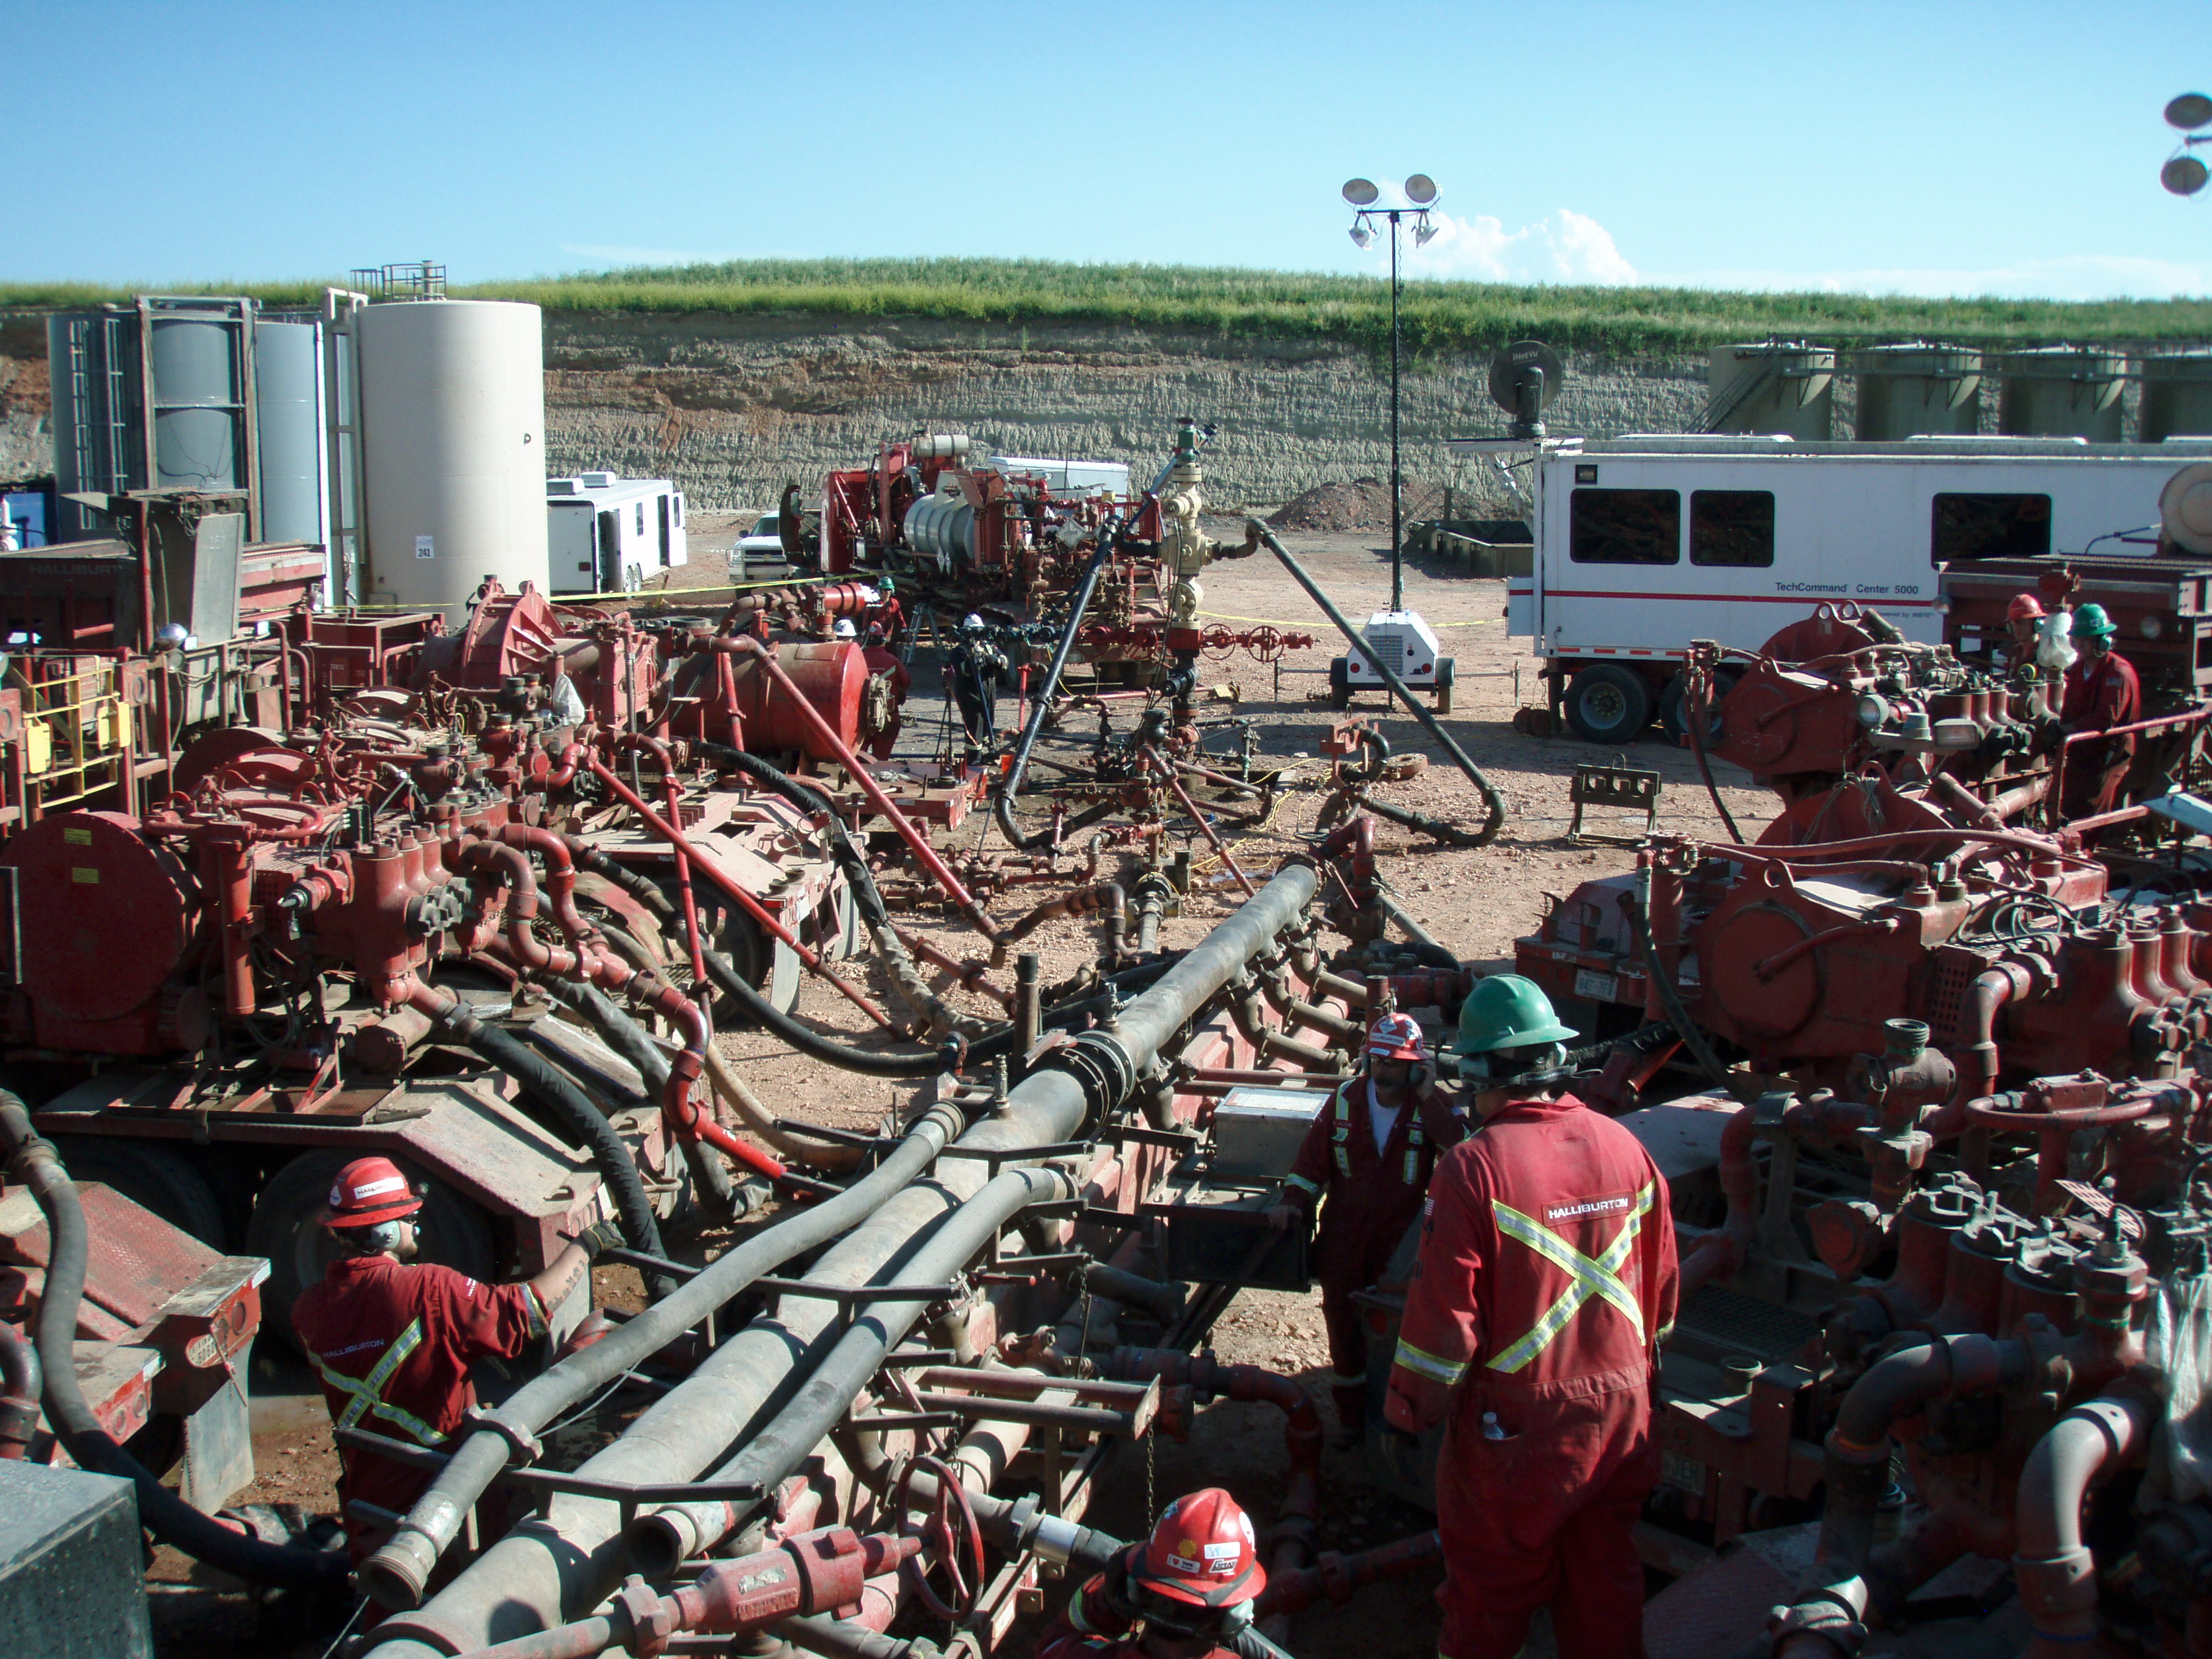
The live stage panel holds targets against actuals — rate, pressure, proppant, fluid volume, elapsed time — so the spread view and the stage plan are finally the same screen.
Unit Drill-down — live trends, run-time counters against service limits, and everything related to the unit in one place.
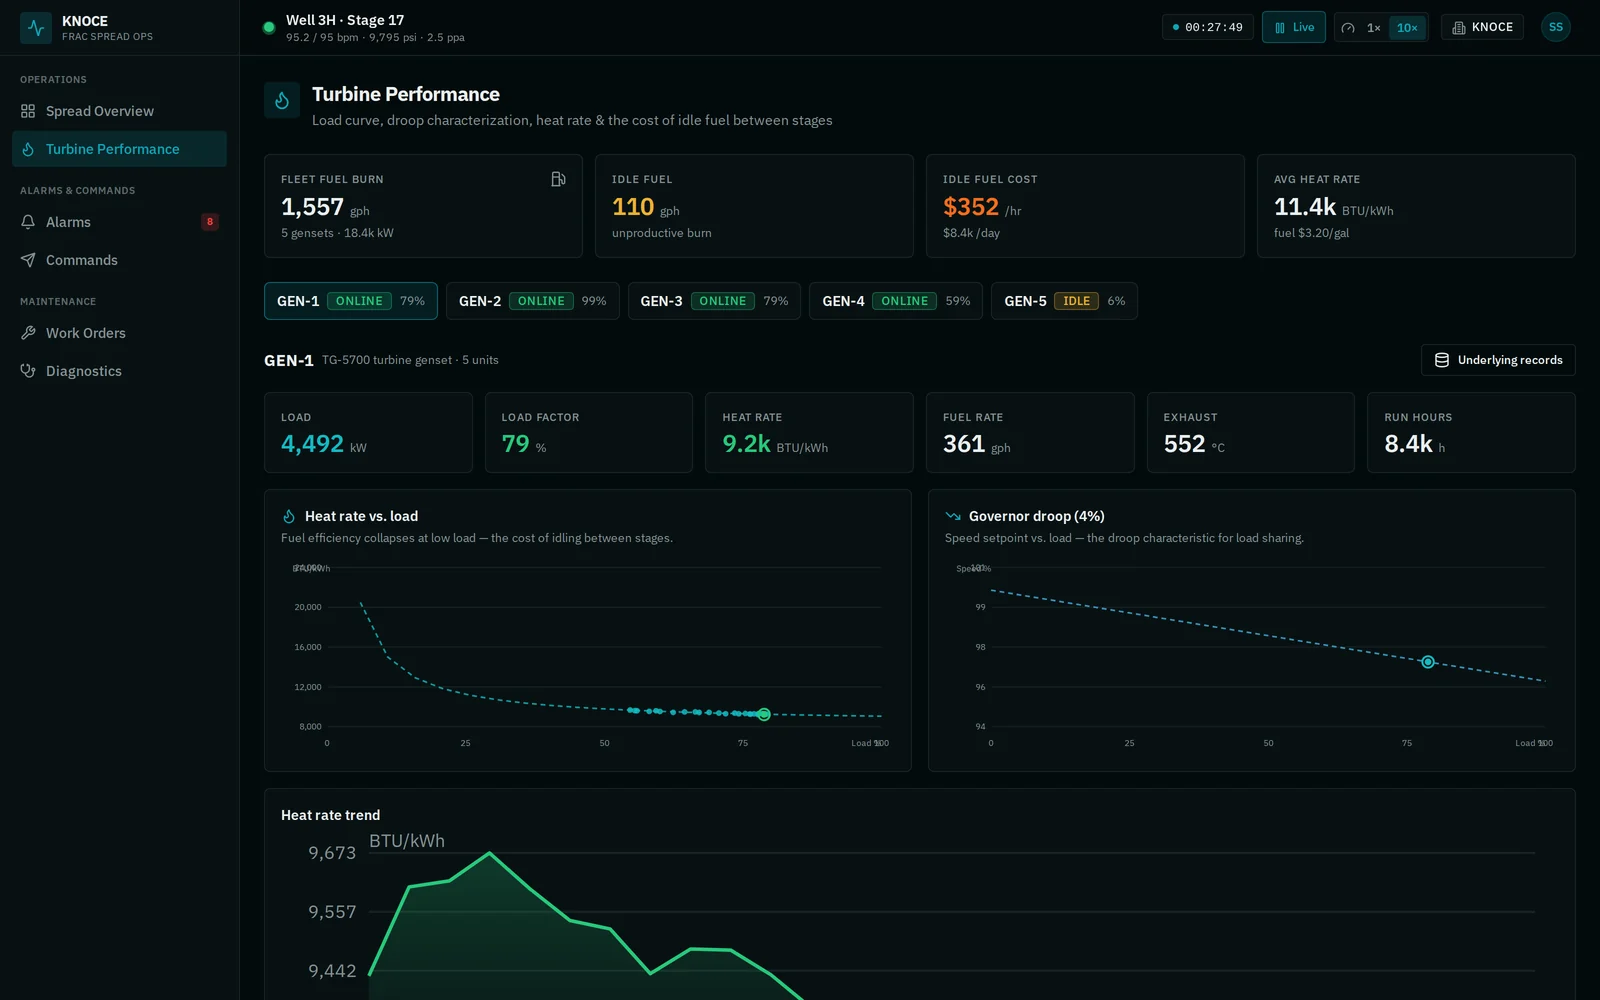
Turbine Performance — heat rate against the ideal curve, governor droop, and idle fuel priced per hour and per day.
Run it with discipline
Alarms and commands your auditor would approve of
Alarm management, to ISA-18.2 practice
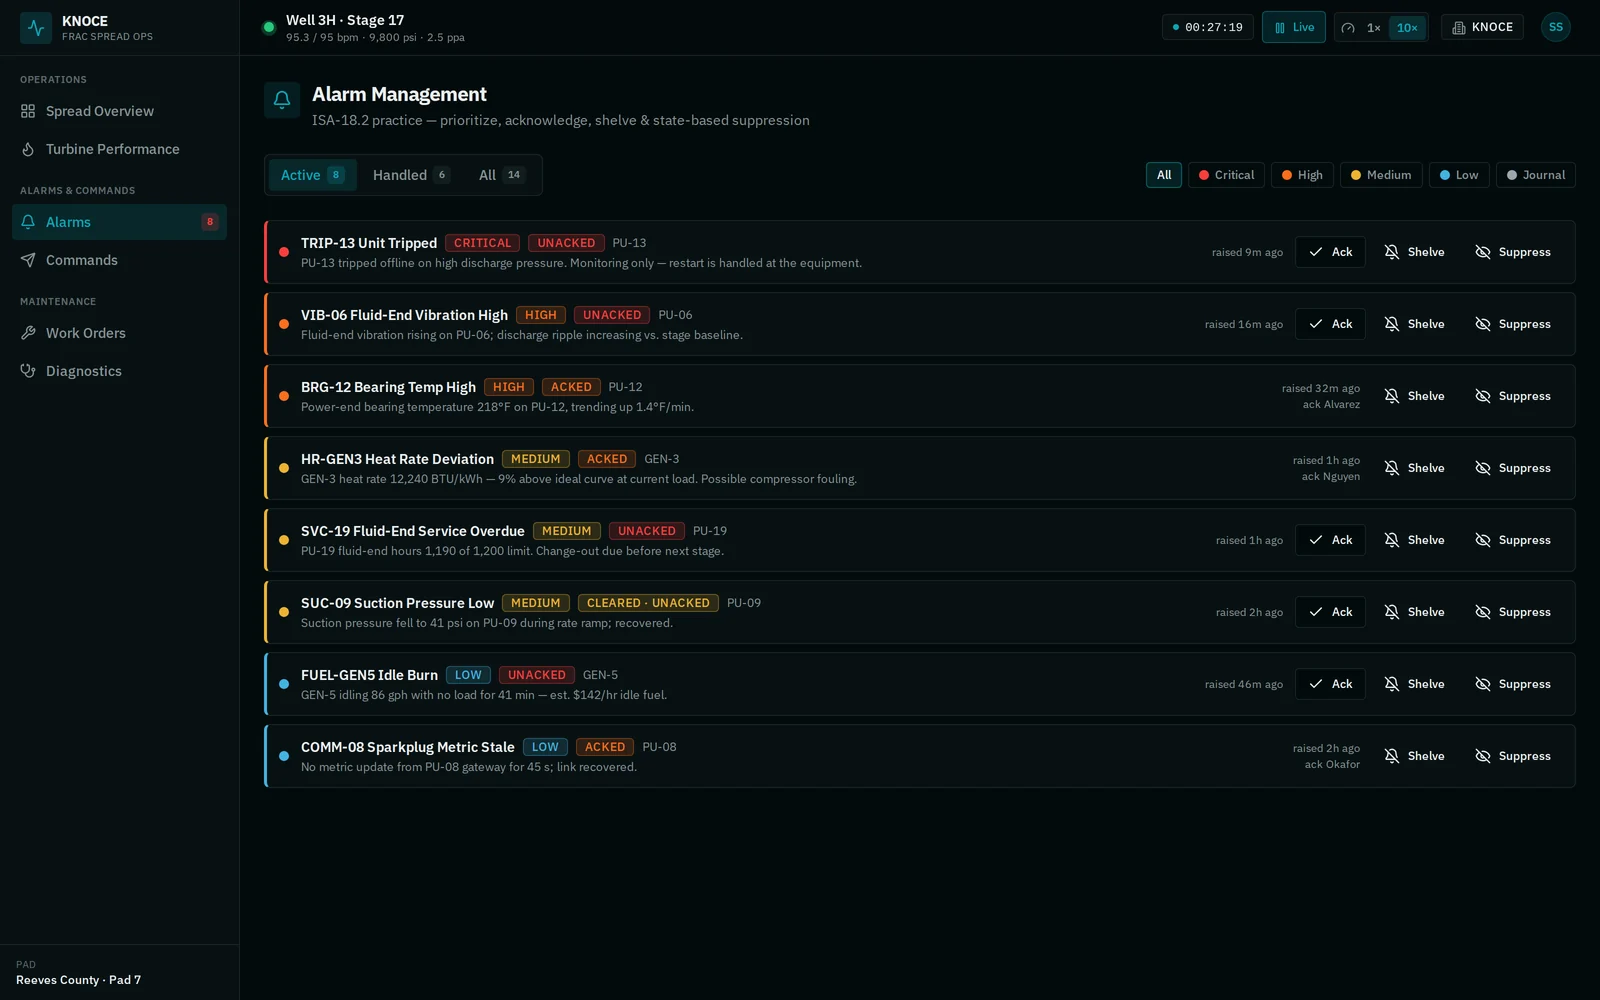
Not a scrolling wall of red. Alarms carry priority (critical, high, medium, low, journal) and a full lifecycle — active, acknowledged, cleared — with shelving and state-based suppression, so nuisance alarms stop training your operators to ignore the board.
- Acknowledge with attribution — who, when, every time
- Shelve with a timer instead of silencing forever
- State-based suppression kills alarm floods at the source
Supervisory command flow
Operational requests — reduce rate, idle a unit, bring one online, hold — move through a five-step flow, every step timestamped and attributed:
Remote operations with a paper trail — the record of who asked, who approved, and what happened exists before anyone asks for it.
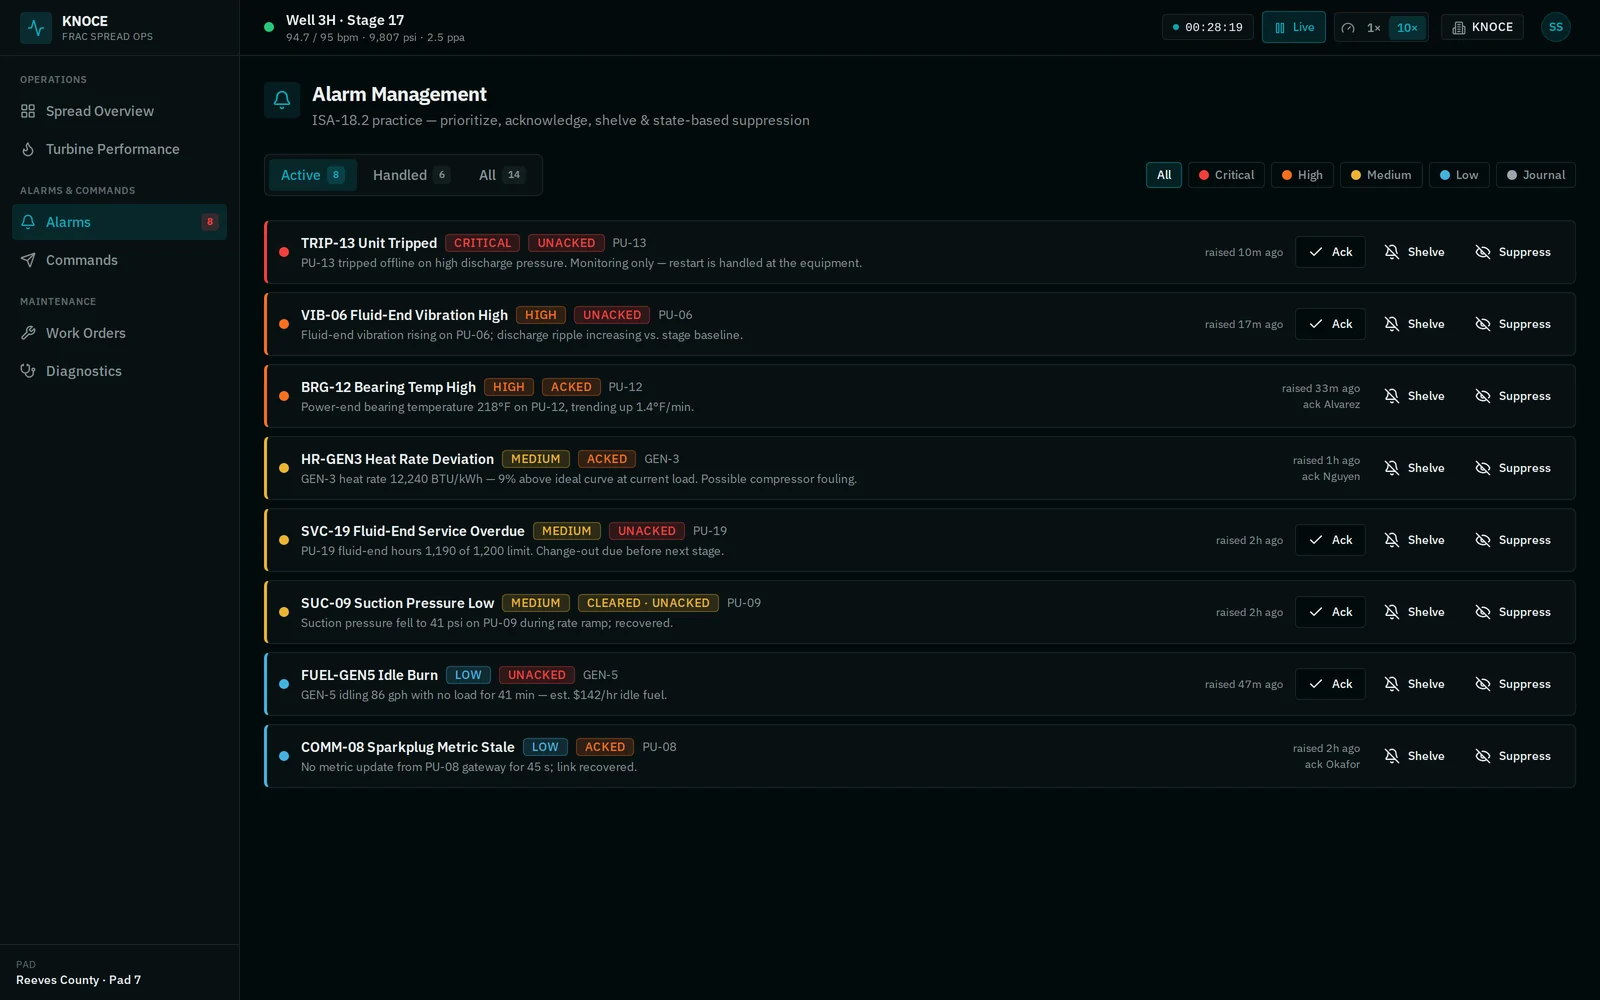
Alarm Management — priorities, acknowledge with attribution, shelve with a timer, state-based suppression.
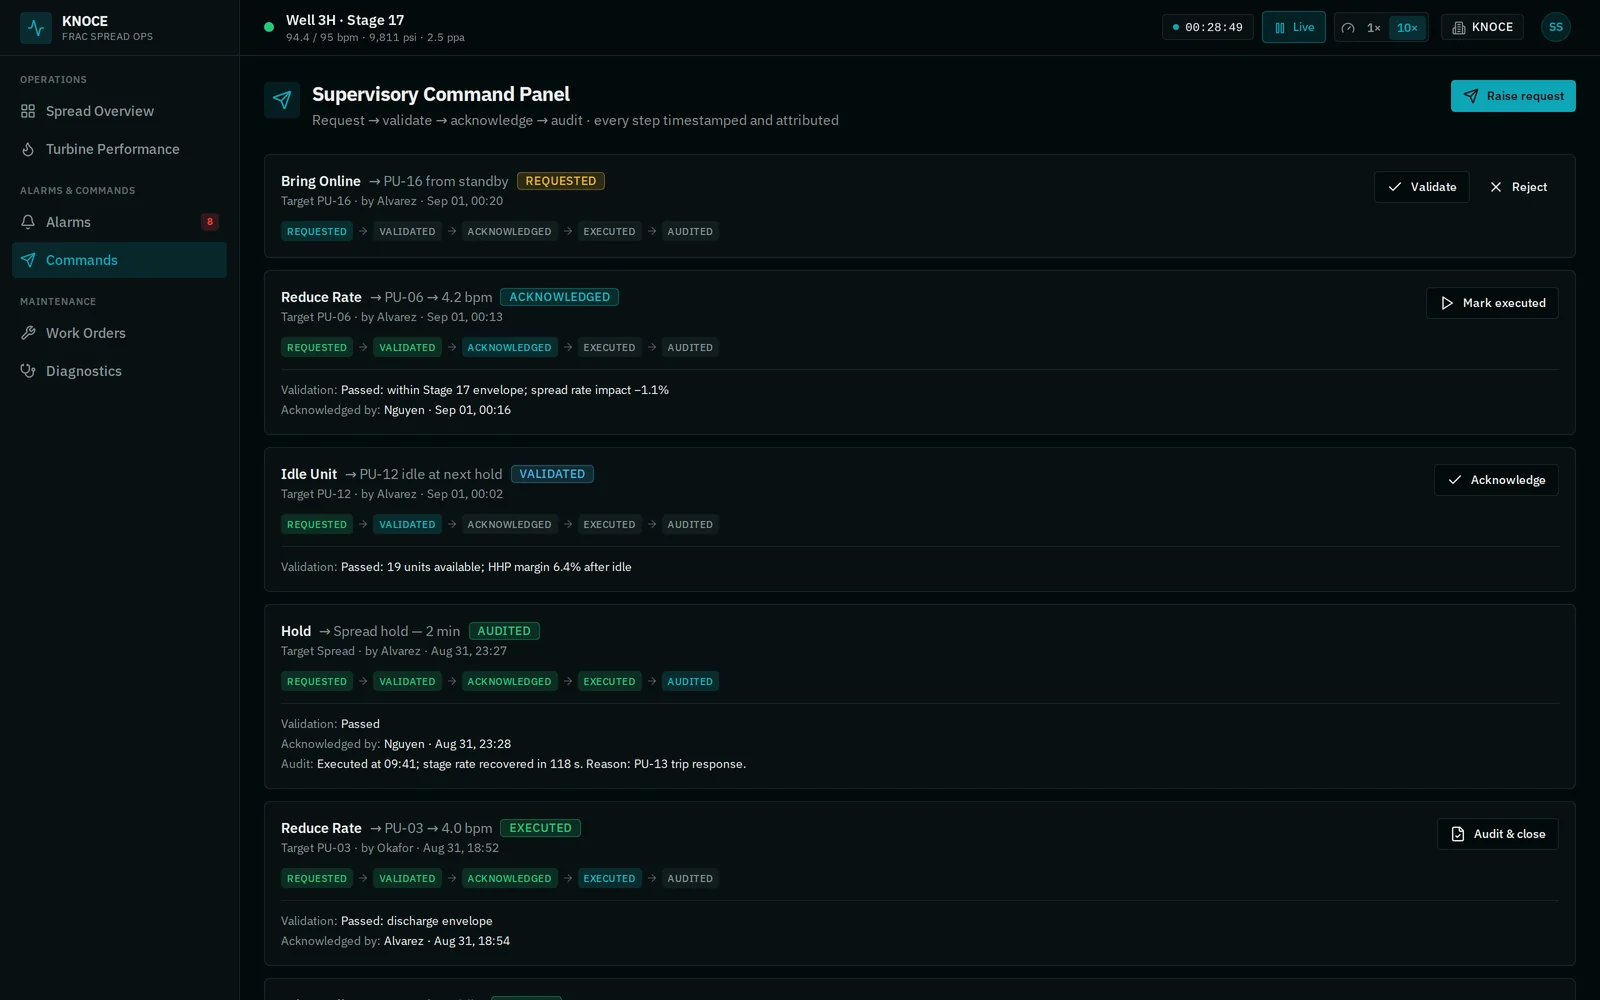
Supervisory Commands — every request timestamped and attributed through validate, acknowledge, execute, and audit.
Maintain on evidence
Findings with receipts. Work orders that write themselves.
Diagnostic findings, evidence cited Pilot
Fluid-end washout. Power-end bearing wear. Compressor fouling. Each finding arrives with a severity, a confidence percentage, and the trend evidence that triggered it — so an engineer can verify the reasoning, not trust a black box. One click turns a confirmed finding into the right work order: a washout becomes a fluid-end change, bearing wear becomes a bearing inspection.
Work orders from run-time, not memory
Fluid-end hours, power-end hours, and total barrels pumped accumulate live on every unit — and when a counter crosses its service limit, the work order raises itself. Orders flow open → assigned → in progress → complete, with a technician completion view built for gloved hands, and every completed job feeding the unit's permanent history.
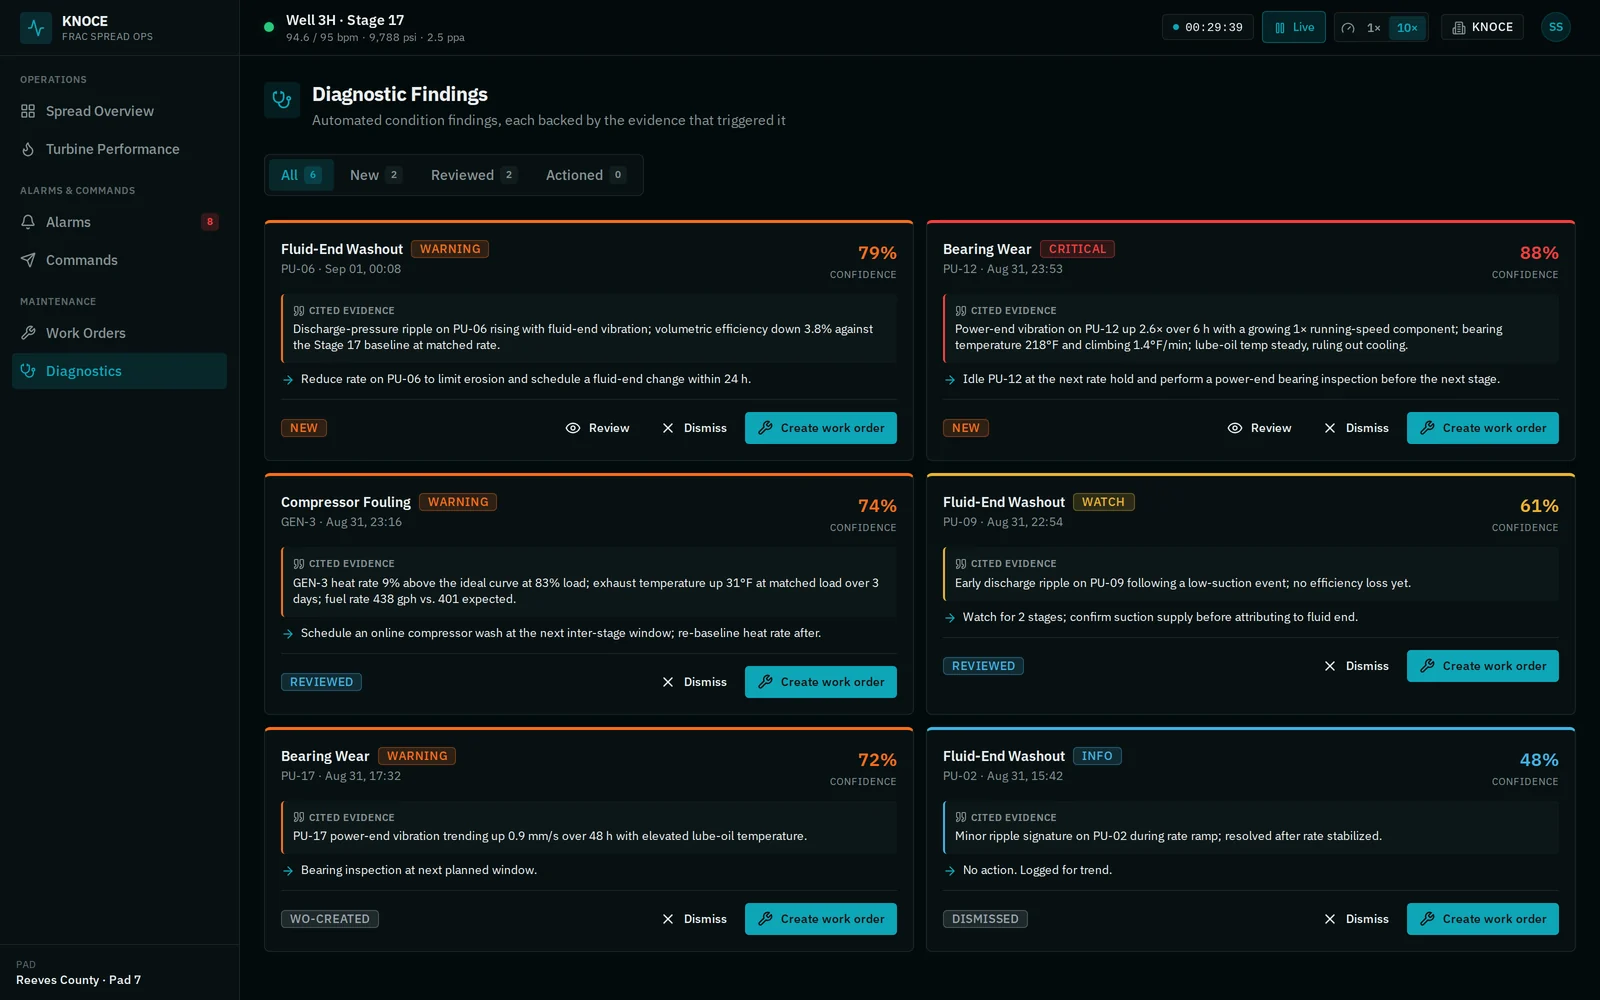
Diagnostic Findings — severity, confidence, cited evidence, and one click to the right work order.
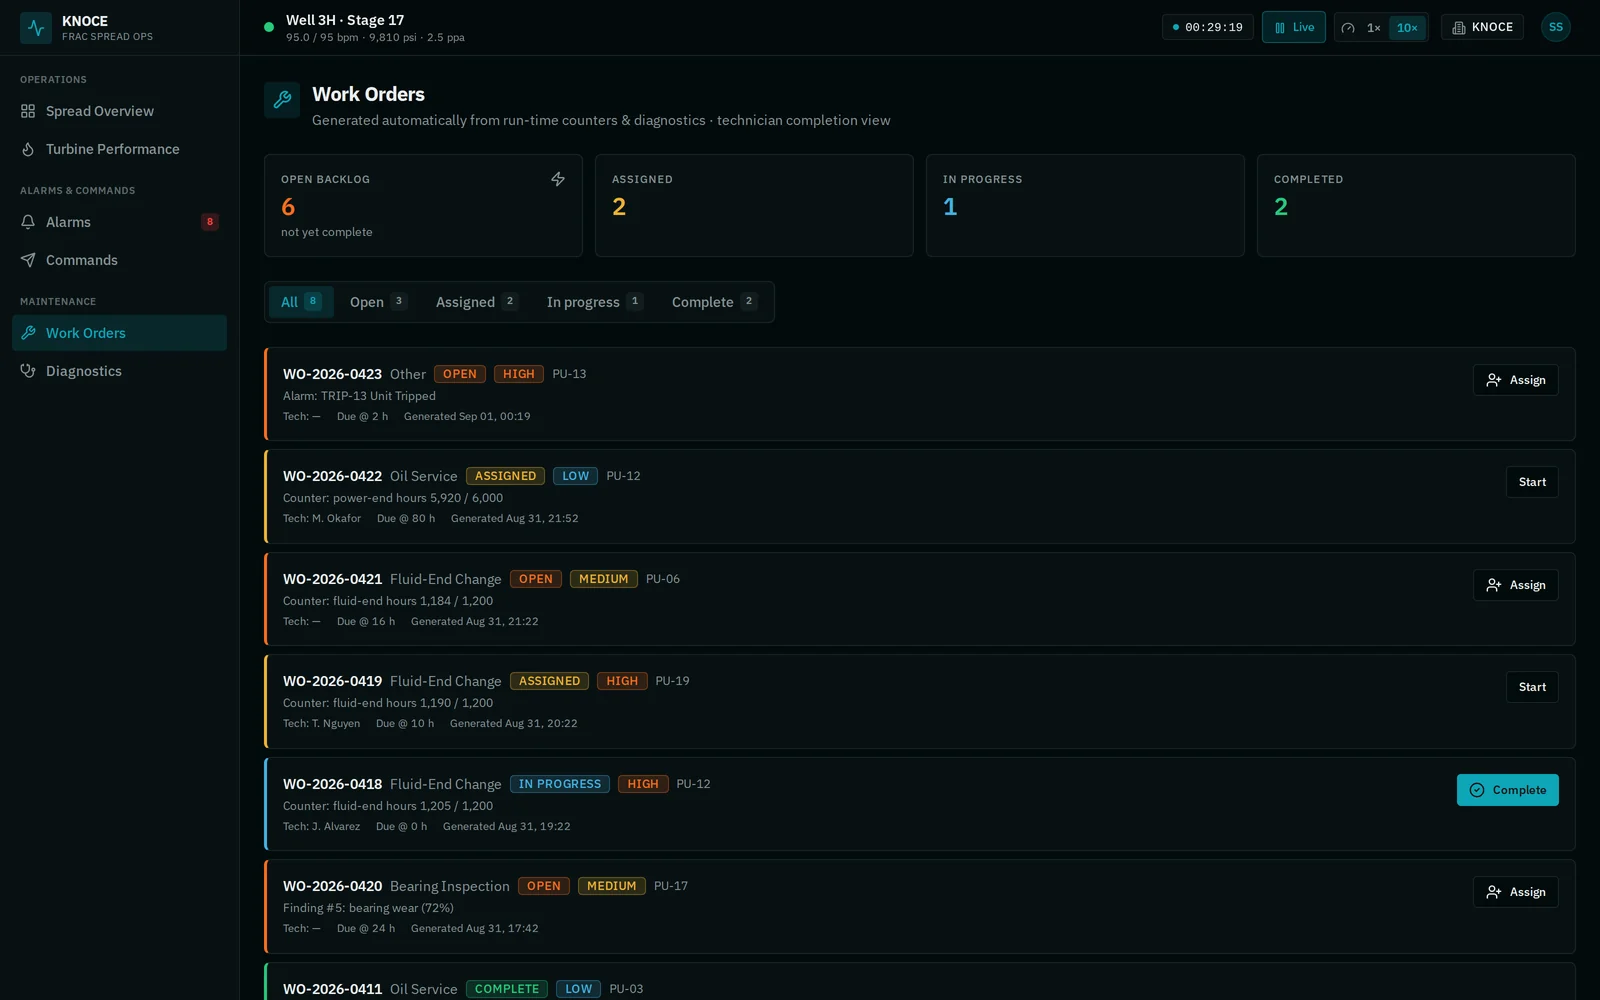
Work Orders — raised from run-time counters and confirmed findings, tracked open to complete.
Where the safety line sits
KNOCE Frac Operations is a monitoring and supervisory-request layer. All protective functions — emergency shutdown, overpressure protection, interlocks — remain with the certified hardware layer, fully independent of this software. That boundary is deliberate, it's how responsible operators expect the stack to be built, and we put it in writing.
Spread economics
One screen the operations manager, the maintenance manager, and the CFO read the same way
What is running, what is degrading, what this operating decision is costing right now, and what maintenance action should happen next. Idle fuel is the first of these; the rest follow the same rule — priced live, at the point of decision.
| Idle fuel cost | Between-stage turbine burn in $/hr and gallons, per genset and across the spread Available |
| Fuel efficiency by genset | Heat rate against the ideal curve; fouling and bad idling both surface, for different reasons Available |
| Hydraulic utilization | HHP delivered against rated, per unit and per spread Available |
| Pump utilization | Running · idle · standby · tripped · maintenance, live, with run-time counters against service limits Available |
| Maintenance cost per pumping hour | Parts and labor from completed work orders divided by productive hours Roadmap |
| Fluid-end cost per barrel / per stage | Fluid-end change-outs against barrels pumped and stages completed Roadmap |
| Downtime cost by cause | Lost pumping hours priced against spread rate, attributed to trip, maintenance, or hold Roadmap |
| Asset-level cost trends | Cost per unit over its life — the number that decides when a unit leaves the fleet Roadmap |
What does idle cost your spread? Run your own numbers.
≈ $1,600/hr while idling · $1,600/day · $584,000/yr in fuel that moved no fluid
Representative arithmetic — your turbines, fuel contract, and stage cadence will differ. The platform prices it live from your own meters.
Under the hood
The signals it speaks natively
Data arrives over MQTT as JSON with named tags — the names the installer gave each sensor, not channel numbers — from KNO1 gateways or existing acquisition, time-synced across every source on the site.
Controls on a typical spread — whoever built the pump
Pump-unit PLCs (Allen-Bradley CompactLogix / ControlLogix, Siemens S7) and mobile machine controllers (Parker IQAN, Danfoss PLUS+1, HED) on the units, blender, and hydration unit. Engine ECMs from Caterpillar, Cummins, and MTU over CAN J1939*. Turbine and genset controllers from Woodward, ComAp, and Deep Sea Electronics over Modbus. On electric fleets, VFDs from ABB, Siemens, Rockwell, and TMEIC. KNOCE reads them where they are — read-only in gateway mode — so a mixed-OEM spread gets one operating layer without anyone replacing a controller.
All product names are trademarks of their owners; references describe protocol connectivity only. * Confirmed per deployment.
discharge_psi · suction_psi · rate_bpm · rpm · power_end_vib · fluid_end_vib · bearing_temp · lube_oil_temp · hhp_used · fluid_end_hours · power_end_hours · total_pumped_bbl · load_kw · load_pct · heat_rate_btu_kwh · fuel_rate_gph · exhaust_temp · stage_targets · proppant